Freedom Solutions
Power BI Portfolio Resource Status Report Pack (.pbix & Excel Bundle)
Power BI Portfolio Resource Status Report Pack (.pbix & Excel Bundle)
Couldn't load pickup availability
Summary
Summary
Manually pulling resource utilisation numbers into rigid spreadsheets shouldn't take up your entire week. This ready-to-use Power BI report handles cross-project tracking, highlights allocation bottlenecks, and provides instant portfolio visibility for PMO leads and programme managers.
Instead of paying a contract data engineer £1,500+ to build a complex capacity model from scratch, you can download this pre-built, native-visual asset and get your resource reporting sorted immediately.
The report pack has been built and designed using sample data to demonstrate how the visuals and structure work in practice. The sample dataset is available separately.
Built exclusively with Microsoft-native visuals, it offers a clean, professional foundation for connecting to real project portfolio data.
Designed for Senior Executives, Portfolio Managers, Programme Managers, Resource Managers, Team Leads, PMOs, and PMO Analysts who need an up-to-date view of resource demand against capacity across the portfolio. Ideal for teams who need to answer "who is working on what and when", identify overallocation risks, and balance workloads across the portfolio.
Report Pack Content
Report 1: Portfolio Resource Status Overview
This report provides an overview of resource allocation and the status of projects, programmes, and the wider portfolio within the chosen timeframe.
- Resource status is automatically calculated by comparing resource demand against available capacity within the given timeframe. If a resource is assigned to a project that exceeds their availability during this period, the status is flagged accordingly.
- Schedule status and Overall status are provided by project teams as qualitative assessments. These offer contextual insight but may vary in interpretation.
Users can navigate from portfolio to programme to individual projects to identify areas requiring attention. Statuses are rolled up through the hierarchy based on the most critical status at each level. For example, if a programme contains three projects and schedule status is marked as Red, the programme and the portfolio schedule status will also be flagged as Red.
Report 2: Resource Availability Timeline
This report can be used on its on own or as a drill-through report. It provides a detailed timeline view of resource availability.
- It displays when resources are free or when and where they are committed across the reporting period and highlights overallocations and opportunities for rebalancing.
- Interactive filters allow users to explore availability by portfolio, programme, project, resource role, resource, resource allocation range, resource business unit , or timeframe to support planning and decision-making.
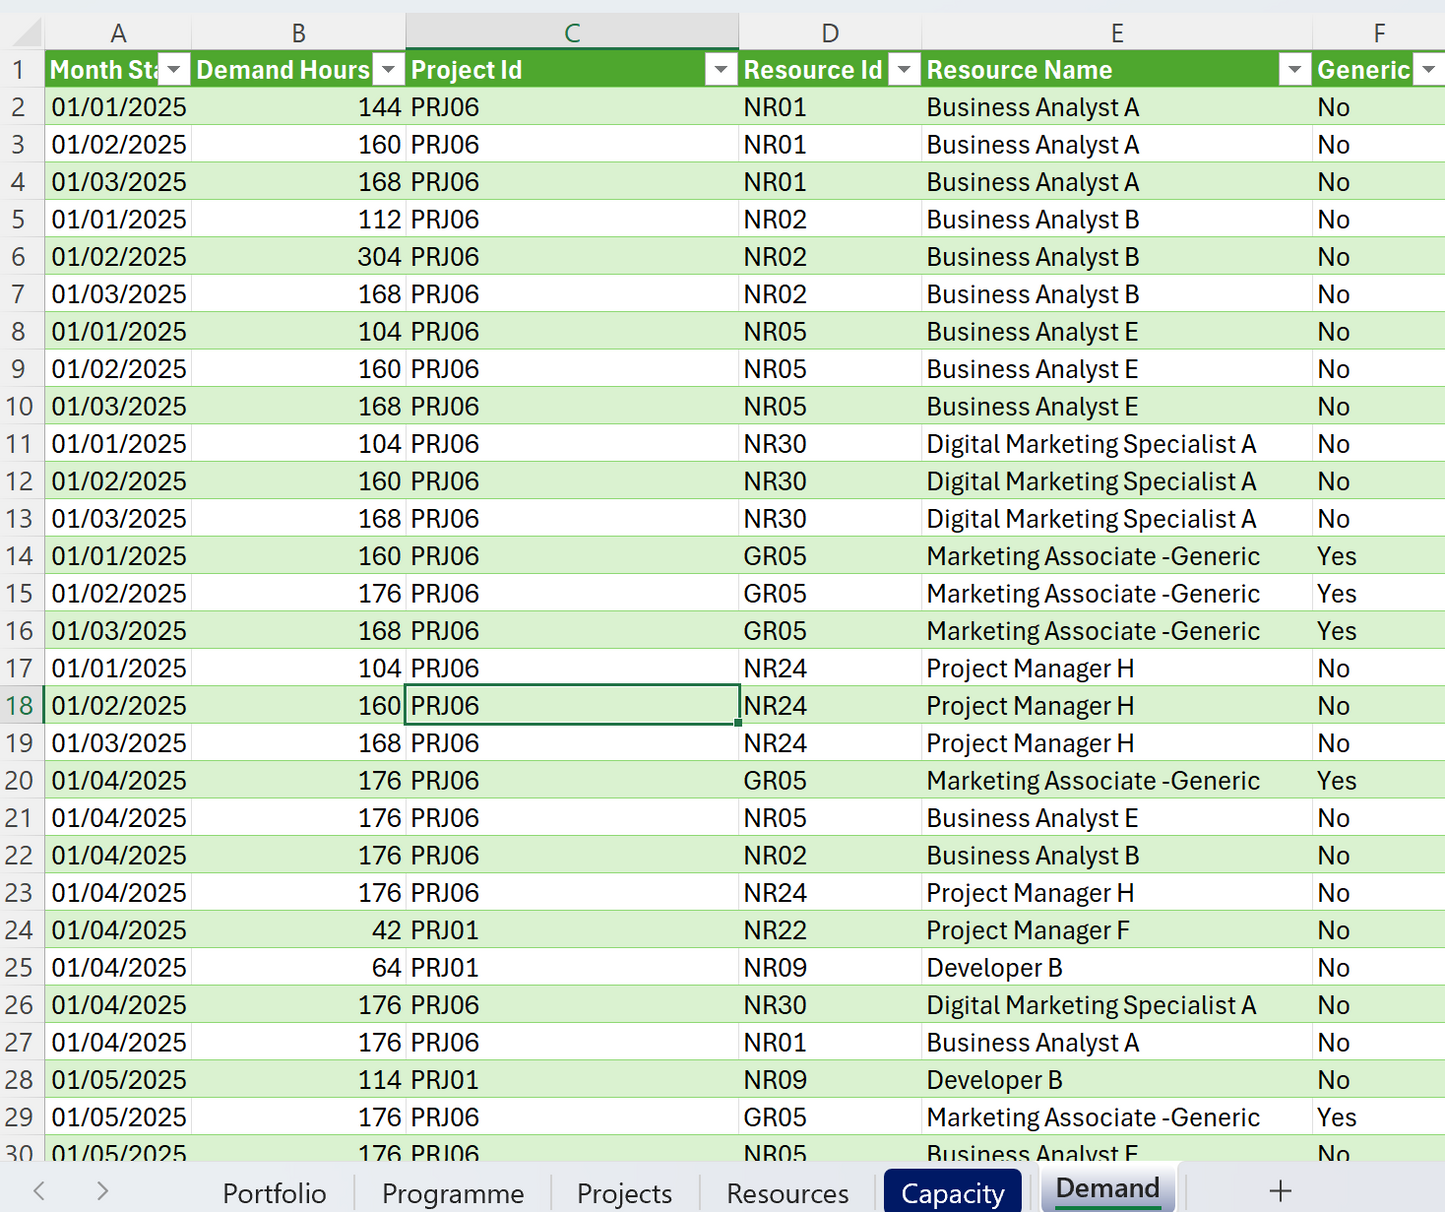
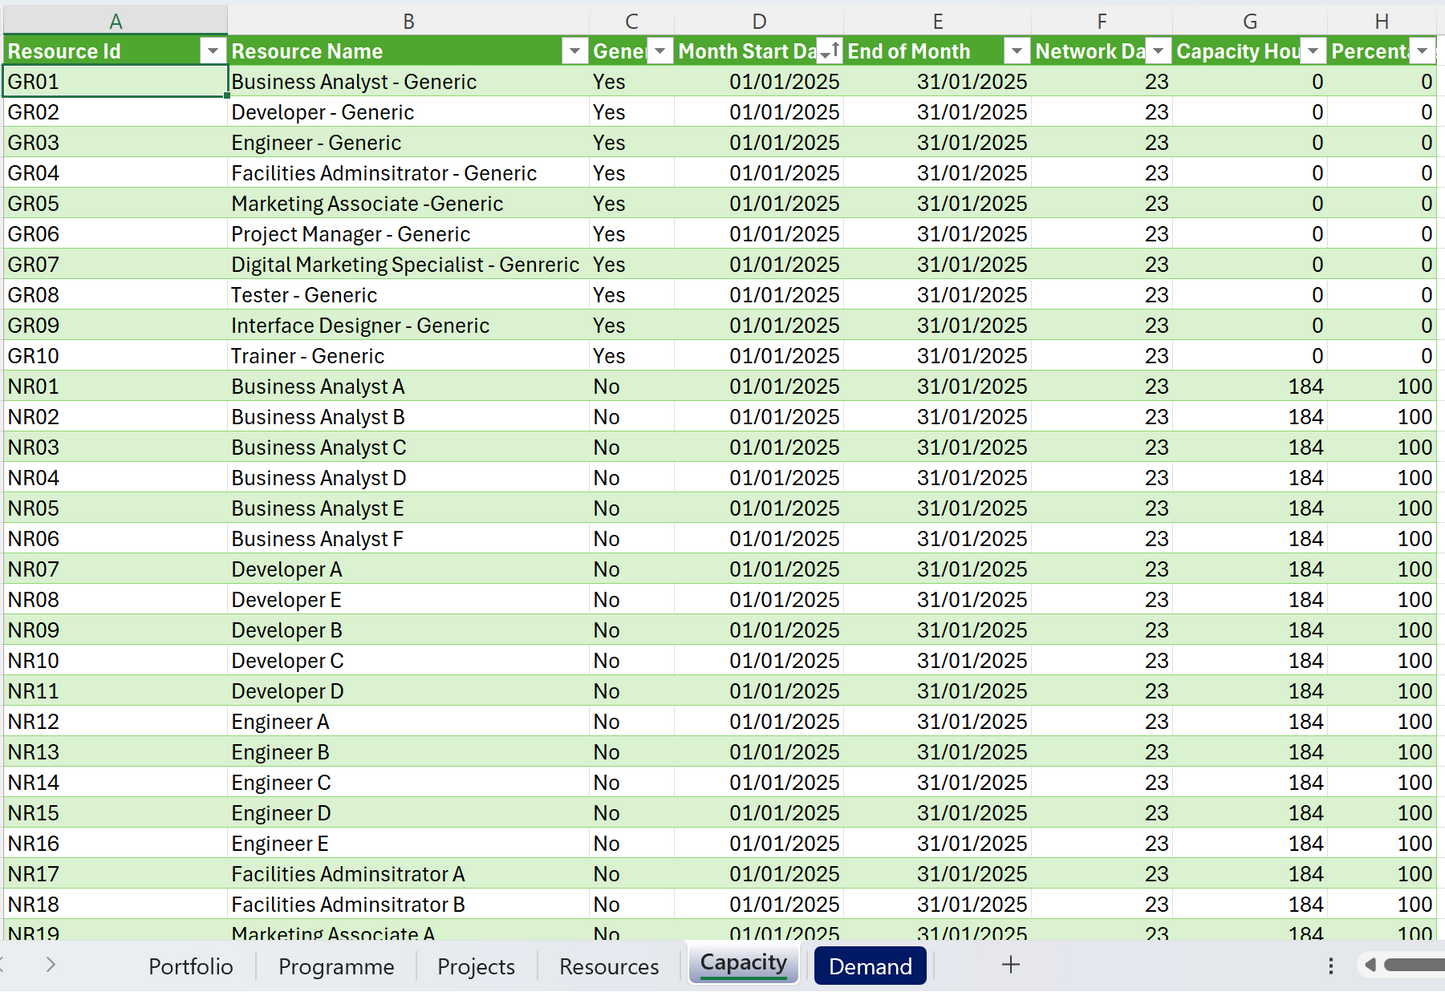
The Portfolio Resource Status Report Pack includes a robust Excel dataset designed to showcase high-fidelity scenarios immediately upon purchase. This sample data features detailed capacity information, demand tracking, and comprehensive dates, allowing users to test advanced metrics before integrating their own data.
How to Use These Reports
- Use the Portfolio Resource Status Overview to monitor strategic resource health and identify risks.
- Use the Resource Availability Timeline to support detailed planning and ensure resources are deployed effectively.
Specifications
Specifications
Provided as a Power BI Desktop (.pbix) report using Excel as its primary data source, it offers a foundational layout that you can customise to suit your Portfolio Resource status needs. The clean, straightforward layout of the report design can assist with creating your own standardised automated portfolio resource status reports.
This report has been created using Power Query, which sets out the data transformation steps in a clear, step‑by‑step way. That makes it easier for beginners and intermediate users of Power BI Desktop to see how the data is shaped and prepared.
The report, including elements such as status thresholds, can be enhanced or extended through DAX or Power Query within Power BI Desktop, or by adjusting the underlying logic in Excel, which is the current data source.
Compatibility:
Built entirely in Power BI Desktop using 100% native visuals. No premium user licenses or custom visual upgrades required.
Works directly out of the box with the included Excel sample data layouts.
The data layer is completely decoupled, meaning, if need be, your internal analysts can easily remap the fields to enterprise PPM systems, databases, or cloud endpoints later.
How to update file path if connecting to Excel data source:
- Download: Save and extract the .zip package containing the .pbix file and the Excel data source.
- Repoint Data: Open the report in Power BI Desktop. Select 'Transform Data' > 'Data Source Settings' and point the source to the included Excel file.
If you're new to Power BI or looking to build your skills, we recommend exploring Microsoft Learn’s Power BI training resources for guided tutorials and best practices.
Download Information
Download Information
We appreciate your support. To ensure you can access your file smoothly, downloads are available for 24 hours after purchase. Please save your copy securely during this period.
Useful Information
Useful Information
If you're new to Power BI or looking to build your skills, we recommend exploring Microsoft Learn’s Power BI training resources for guided tutorials and best practices.
Suitable for users with beginner to intermediate Power BI experience. Simply connect your project dataset that has similar data as the sample file visuals and you're ready to start customising your own report.
Reports are updated quarterly to reflect improvements and changes in Power BI Desktop. If your colleagues or friends would benefit, please invite them to visit our website so they can download their own latest copy.
We believe project reporting should be straightforward and affordable for everyone, not just large teams with enterprise budgets. This report is built with that in mind. And when you buy it, you're also helping us keep creating resources that make reporting a little less painful for everyone.
Small Print
Small Print
This report has been created by FREEDOM SOLUTIONS and is not affiliated with or endorsed by Microsoft. Microsoft and all Microsoft product names including but not limited to Power BI, Excel, Power Apps, Power Automate, SharePoint, Teams and Office are trademarks of Microsoft Corporation.
This report is provided for individual use only. You are welcome to explore and adapt it for your own projects and learning. Redistribution, resale, or public sharing including modified versions is not permitted without written permission.
By downloading the files, you accept Freedom Solutions Terms of Service.
© 2026 Freedom Solutions. All rights reserved.
Share