Freedom Solutions
Power BI Test Dashboard (.pbix and Excel Bundle)
Power BI Test Dashboard (.pbix and Excel Bundle)
Couldn't load pickup availability
Summary
Summary
Tracking software testing velocities and defect pipelines on massive enterprise projects shouldn't involve manual spreadsheet tracking or rigid corporate tools. This ready-to-use Power BI dashboard delivers a clean, high-level view of testing progress, execution speed, and delivery risk designed specifically for QA leads, project managers, and PMO teams.
Instead of spending days building custom date dimensions and trying to link multiple testing fact tables, you can download this compiled, native .pbix file and get your quality assurance reporting sorted today for a fraction of a consultant's day rate.
What’s Included:
- Power BI (.pbix) File: A fully functional report featuring professional visualisations and automated status summaries.
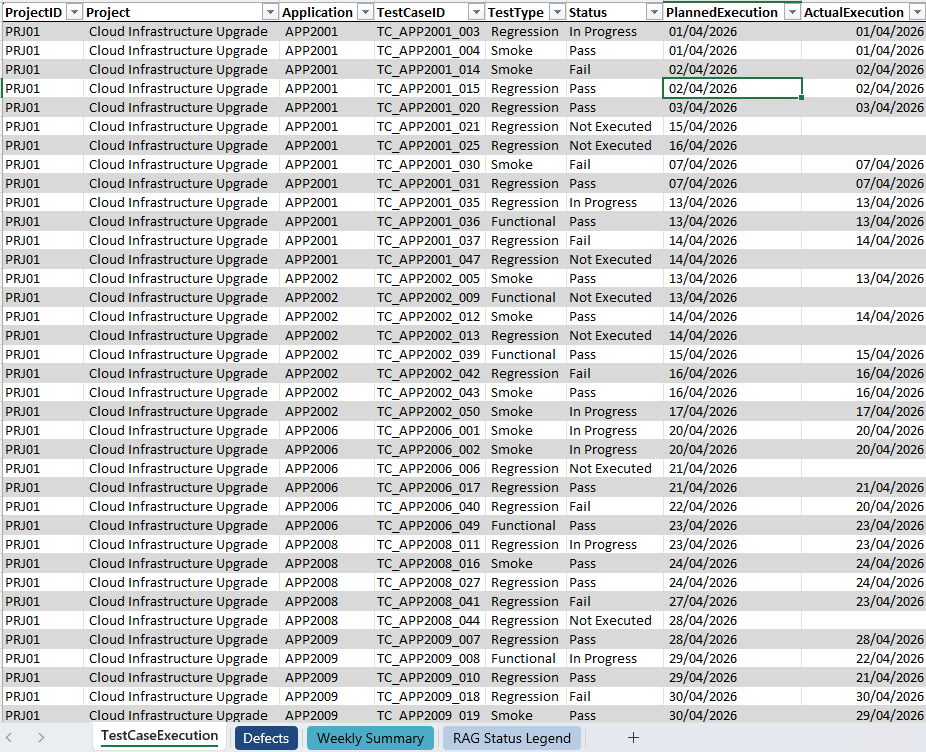
- Comprehensive Test Data (Excel): A meticulously structured dataset covering Test Case Execution and Defect tracking. This data is fully pre-mapped to provide an immediate plug-and-play experience.
- Central Projects Architecture: A relational model linked to a central project table, enabling the management of multiple workstreams within a single report.
- Friday-Ending Date Logic: A custom Date Dimension configured for a Friday-to-Friday reporting cycle, aligning with standard UK business weeks.
- DAX: Pre-built measures for "Actuals" and "Defects" that handle complex data relationships and inactive links automatically.
- Built exclusively with Microsoft-native visuals, it offers a clean foundation for connecting to real project test data.
Why this is delivered as a .pbix instead of a .pbit template:
We avoid blank template files on purpose. Opening an empty template forces you to fight data connection errors and prompts before you can even see what the dashboard layout looks like.
Because Power BI caches data inside native .pbix files, you can double-click this download and immediately see the complete visual layout, review the cross-project page mechanics, and look at the underlying DAX and Power Query logic. The visual grid stays completely intact. You only need to link your local Excel file path when you are ready to update the report with your actual project tracking data.
Specifications
Specifications
Transparent Engineering: Built using Power Query and DAX, the report sets out every transformation step clearly. This makes it an ideal learning tool for beginners whilst remaining powerful enough for intermediate users to extend.
Locked Reporting Context: The report utilises Page-Level Filters to fix the view to "Last Week" and specific projects. This ensures a clean, tamper-proof "Close of Business" snapshot for executive reviews without the clutter of on-canvas slicers.
Cross-Table Intelligence: The model expertly bridges the link between Test Cases and Defects. It uses advanced DAX to manage multiple fact tables without causing relationship conflicts.
Strategic Visibility: The report focuses on velocity vs. plan, allowing stakeholders to see if the programme is genuinely "On Track" or if the trends suggest an upcoming delay.
Provided as a Power BI Desktop (.pbix) report, it offers a foundational layout that you can customise to suit your project needs. The clean, straightforward layout of the report design can assist with creating your own standardised automated project test status reports.
If you're new to Power BI or looking to build your skills, we recommend exploring Microsoft Learn’s Power BI training resources for guided tutorials and best practices.
Quick Start Instructions
- Download: Save and extract the .zip package containing the .pbix file and the Excel data source.
- Repoint Data: Open the report in Power BI Desktop. Select 'Transform Data' > 'Data Source Settings' and point the source to the included Excel file.
- Filter & Refresh: Use the Filters Pane to select your project and the "Last Week" period. The visuals will update instantly with the starter data.
Download Information
Download Information
We appreciate your support. To ensure you can access your file smoothly, downloads are available for 24 hours after purchase. Please save your copy securely during this period.
Useful Information
Useful Information
If you're new to Power BI or looking to build your skills, we recommend exploring Microsoft Learn’s Power BI training resources for guided tutorials and best practices.
Suitable for users with beginner to intermediate Power BI experience. Simply connect your project dataset that has similar data as the sample file visuals and you're ready to start customising your own report.
Each quarter, the reports are refreshed to highlight the latest improvements and updates in Power BI Desktop. If your colleagues or friends would benefit, please invite them to visit our website so they can download their own latest copy.
We believe project reporting should be straightforward and affordable for everyone, not just large teams with enterprise budgets. This report is built with that in mind. And when you buy it, you're also helping us keep creating resources that make reporting a little less painful for everyone.
Small Print
Small Print
This report has been created by FREEDOM SOLUTIONS and is not affiliated with or endorsed by Microsoft. Microsoft and all Microsoft product names including but not limited to Power BI, Excel, Power Apps, Power Automate, SharePoint, Teams and Office are trademarks of Microsoft Corporation.
This report is provided for individual use only. You are welcome to explore and adapt it for your own projects and learning. Redistribution, resale, or public sharing including modified versions is not permitted without written permission.
By downloading the files, you accept Freedom Solutions Terms of Service.
© 2026 Freedom Solutions. All rights reserved.
Share