Freedom Solutions
FREE Power BI Gantt Chart Visual for Dependency Lines & Data Prep Guide
FREE Power BI Gantt Chart Visual for Dependency Lines & Data Prep Guide
Couldn't load pickup availability
The Microsoft Power BI Gantt visual is powerful - but poorly documented. Most issues with milestones, parent tasks, and sorting aren't visual configuration problems; they're data preparation problems. This free resource gives you what the official documentation doesn't: how to structure your data model for milestones, parent tasks, and correct task sorting, plus a basic dependency lines/links feature not included in the original visual.
Who will it benefit:
PMOs and Power BI Developers building Gantt charts for project tracking who are struggling with data structure or missing dependency line functionality.
Overview
Overview
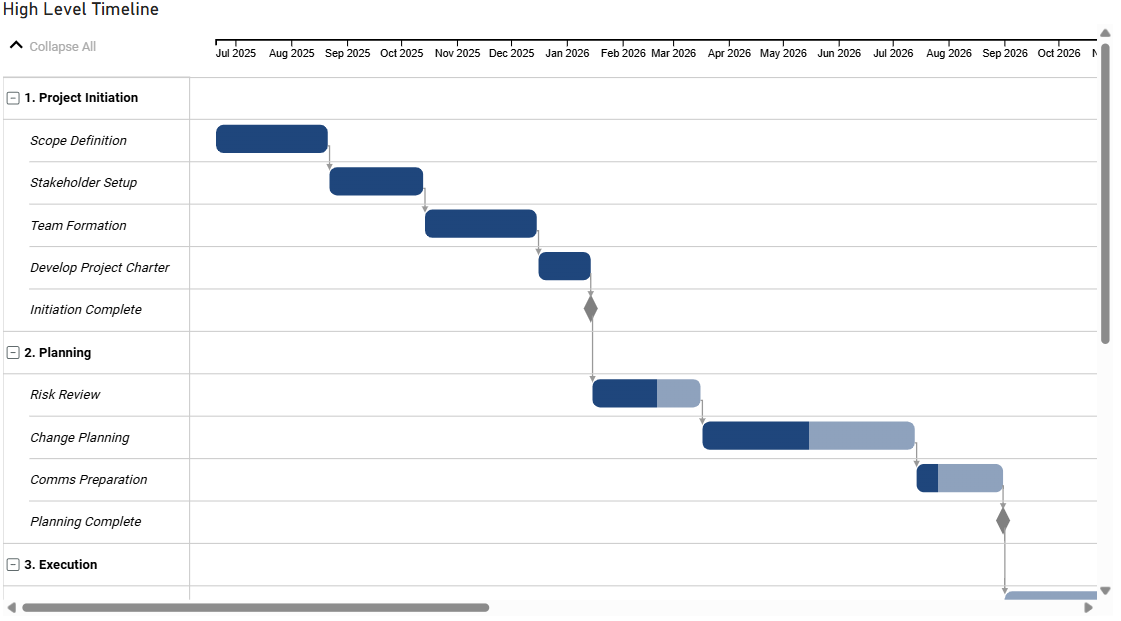
A simple, native Power BI Gantt chart visual designed for quick project monthly timeline reporting with dependency lines. This free PBIX gives you a ready‑made Gantt layout you can adapt to your own data model without custom visuals, external dependencies or security concerns.
What's included
What's included
Power BI custom visual file (.pbiviz) and data prep guide in PDF.
- Compatibility: Power BI Desktop (latest recommended)
- Visual: Power BI Gantt (open-source, MIT licence)
- Covers: Milestones, parent tasks, task sorting, basic dependency lines
- Dependency lines: Configured for monthly timeline view only - may not work correctly with other timeline types (e.g. weekly, quarterly)
- Support: None - provided as-is
- Source: Based on the Microsoft GitHub solution starter
- Lifetime updates - if the file is improved or updated in the future, you’ll receive the new version.
How to use it
How to use it
Data preparation is the key to unlocking the full capability of the native visual and this customised visual. The guide included in the zip file focuses on getting your data model right before touching any visual settings.
The dependency lines feature included is basic and configured for monthly timeline view only - it may not work correctly with other timeline types such as weekly or quarterly. It demonstrates the concept and can be extended to suit your requirements. This resource is built on Microsoft's open-source Power BI Gantt visual, available on GitHub.
Benefits
Benefits
- Fixes the most common Gantt issues
Corrects problems with milestones, parent tasks and task sorting by showing the exact data‑model structure the Microsoft visual requires. - Provides the missing documentation Microsoft never wrote
Gives users clear, practical guidance on how the Gantt visual actually works behind the scenes. - Ensures proper milestone and parent‑child behaviour
Helps users structure their data so milestones display correctly and parent tasks group as expected. - Delivers reliable task sorting
Explains how to build sort fields so tasks appear in the correct order every time — no more broken or random sorting. - Includes a simple dependency‑line technique
Demonstrates a basic method for adding dependency lines, something the official visual does not support. - Uses only native Power BI visuals
No marketplace downloads, no custom visuals, no security concerns — fully InfoSec‑friendly. - Saves hours of trial‑and‑error
Eliminates the guesswork and frustration users face when trying to fix Gantt behaviour on their own. - Ideal for PMOs and Power BI developers
Helps both technical and non‑technical users who need a dependable Gantt chart for project timelines and milestone tracking. - A perfect starting point for project reporting
Easy to drop into any report and adapt to your own data model.
Important notes
Important notes
Based on Microsoft's open-source Gantt visual (MIT licence). Provided as-is. No direct support is offered - refer to the GitHub repository (https://github.com/microsoft/powerbi-visuals-gantt) for visual-related issues.
Note: the dependency lines feature is configured for monthly timeline view only and may not function correctly with other timeline types.
Discalimer:
The customised Gantt chart visual is provided free of
charge. Freedom Solutions provides this visual and the accompanying guidance on an as‑is basis and does not accept any responsibility or liability for any loss, damage, or impact of any kind arising from its use. Users are responsible for ensuring that the visual and any related outputs are suitable for their own reporting, data, and organisational requirements.
Share