Freedom Solutions
Power BI Portfolio Resource Dashboard Report Pack - PBIX + Excel
Power BI Portfolio Resource Dashboard Report Pack - PBIX + Excel
Couldn't load pickup availability
This Power BI template provides a clear view of resource demand and capacity across your project portfolio. It highlights allocation bottlenecks, upcoming demand and workload pressure in one interactive dashboard, giving PMO teams and programme managers instant visibility of how resources are distributed across the portfolio. Built with Microsoft‑native visuals and sample data, it offers a clean, professional foundation for connecting to real resource and project information.
This is a ready to use Power BI template delivered as a PBIX sample report, so you can explore the structure immediately and connect your own data. Unlike a PBIT template, a PBIX sample report lets you explore all visuals, pages and interactions immediately without connecting a data source first.
For the Claude & AI Developers
🤖 Claude-Ready Native Blueprint
- No hidden code, zero dodgy third-party plugins, and no weird custom scripts.
- We build our models using 100% native DAX and/or clean Power Query M-code, so they're completely transparent.
- If you’re using Claude Code, Claude Desktop, or an MCP server, just save this file as a Power BI Project (.pbip). It exposes the clean semantic model straight to your AI agent so you can spin up new measures or scale the framework without any hallucinations or formatting errors.
Overview
Overview
This report provides a structured portfolio resource view in Power BI. It includes pages for capacity, utilisation, project demand, role allocation and resource timelines, with slicers that let you switch between portfolios, programmes, projects, roles and business units.
What's included
What's included
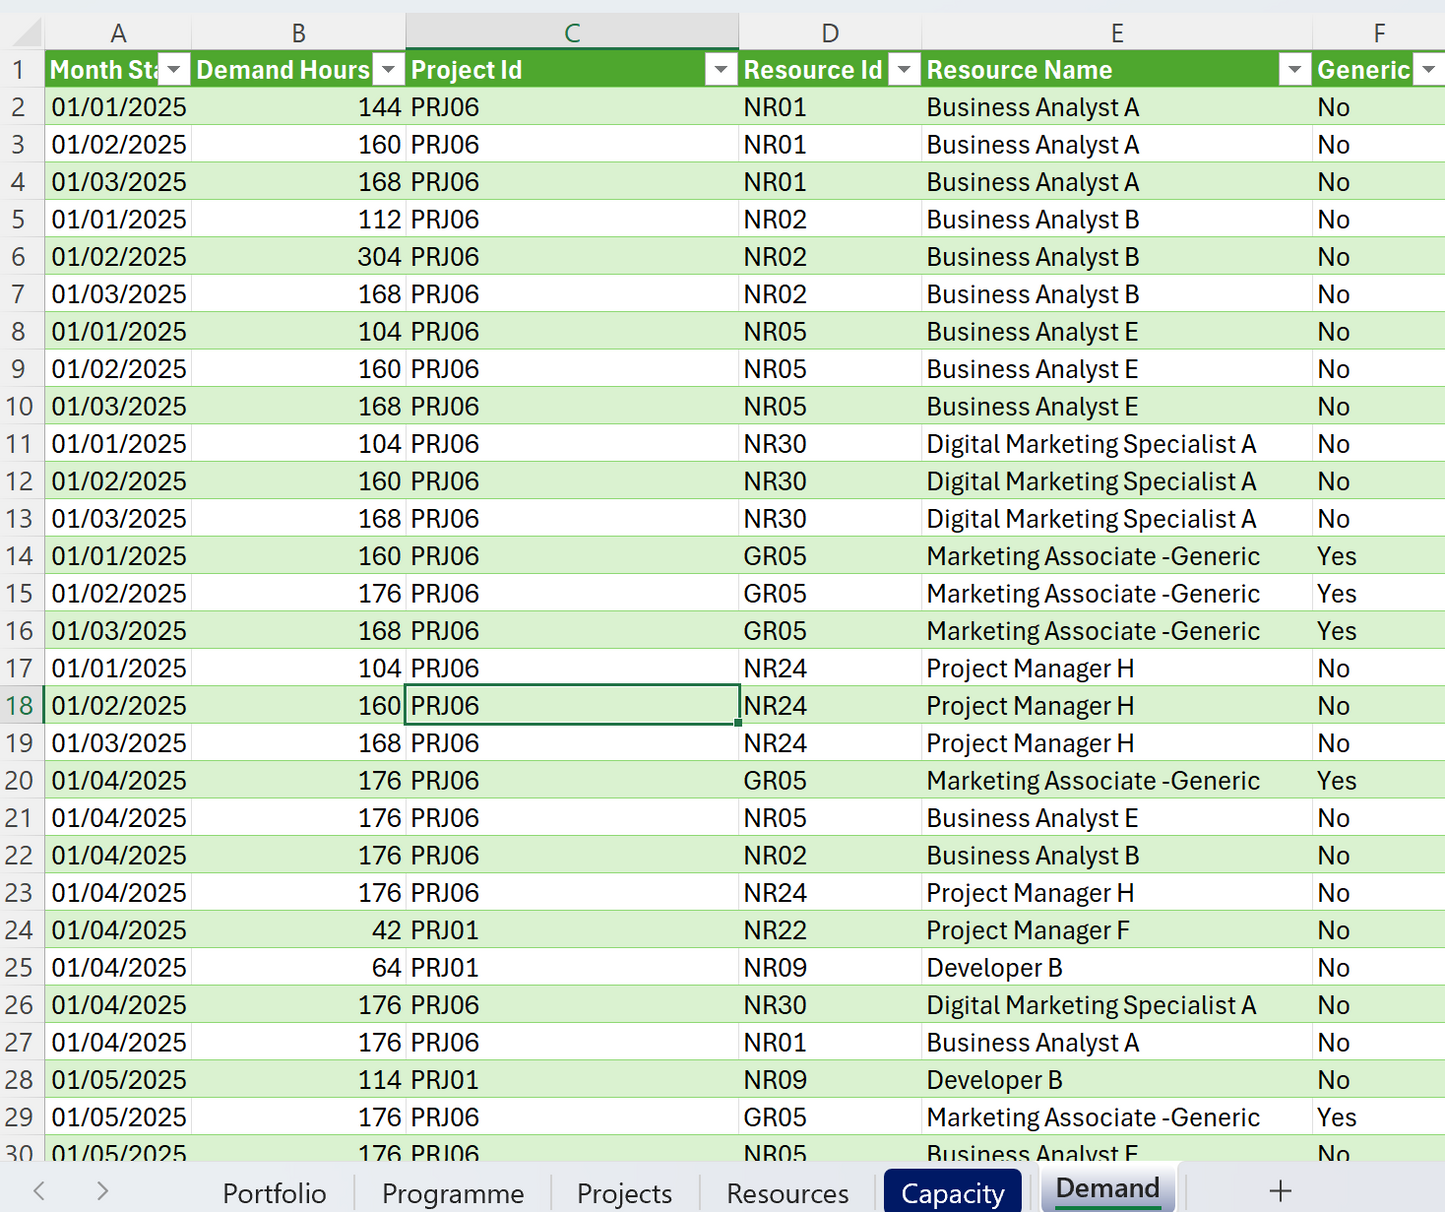
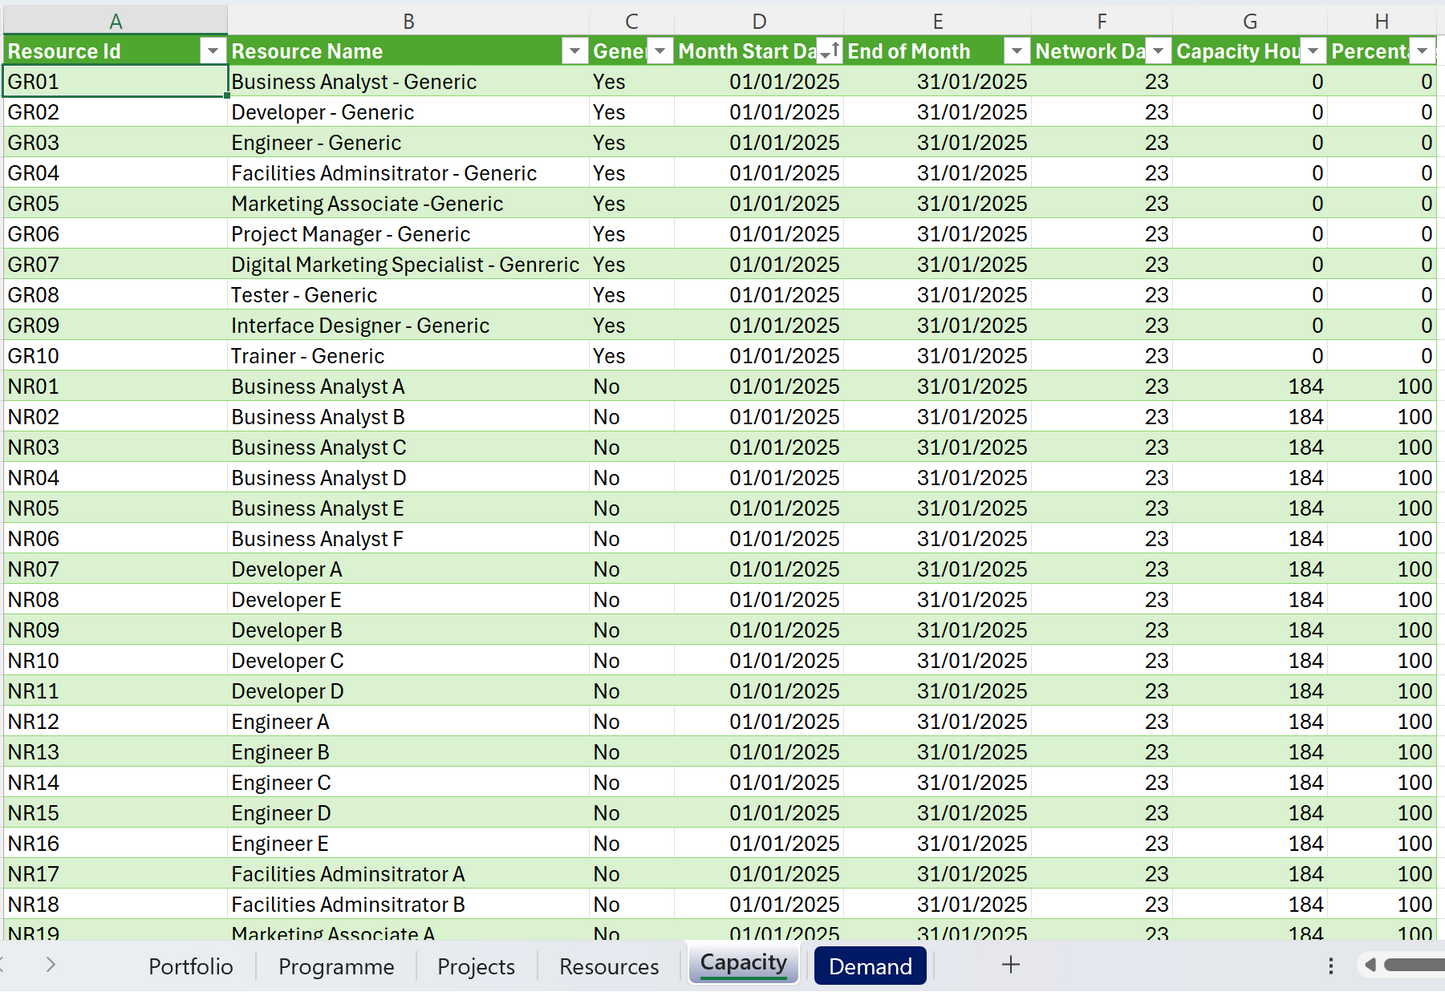
The download contains the Portfolio Resource Status PBIX sample report with an Excel data schema that demonstrates capacity, demand and allocation scenarios. The PBIX includes pages for portfolio status, programme and project drill throughs, role distribution and resource availability timelines.
Free lifetime updates - if the file is improved or updated in the future, you’ll receive the new version at no extra cost.
Report Pack Content
Report 1: Portfolio Resource Status Overview
This report provides an overview of resource allocation and the status of projects, programmes, and the wider portfolio within the chosen timeframe.
- Resource status is automatically calculated by comparing resource demand against available capacity within the given timeframe. If a resource is assigned to a project that exceeds their availability during this period, the status is flagged accordingly.
- Schedule status and Overall status are provided by project teams as qualitative assessments. These offer contextual insight but may vary in interpretation.
Users can navigate from portfolio to programme to individual projects to identify areas requiring attention. Statuses are rolled up through the hierarchy based on the most critical status at each level. For example, if a programme contains three projects and schedule status is marked as Red, the programme and the portfolio schedule status will also be flagged as Red.
Report 2: Resource Availability Timeline
This report can be used on its on own or as a drill-through report. It provides a detailed timeline view of resource availability.
- It displays when resources are free or when and where they are committed across the reporting period and highlights overallocations and opportunities for rebalancing.
- Interactive filters allow users to explore availability by portfolio, programme, project, resource role, resource, resource allocation range, resource business unit , or timeframe to support planning and decision-making.
How to use it
How to use it
Power BI Desktop is required to open and use this report. No Premium or Fabric licences are needed unless you choose to publish it to the Power BI Service.
How to update file path if connecting to Excel data source:
- Download: Save and extract the .zip package containing the .pbix file and the Excel data source.
- Repoint Data: Open the report in Power BI Desktop. Select 'Transform Data' > 'Data Source Settings' and point the source to the included Excel file.
How to Use the Report Pack
- Use the Portfolio Resource Status Overview to monitor strategic resource health and identify risks.
- Use the Resource Availability Timeline to support detailed planning and ensure resources are deployed effectively.
Want a completely hands-off setup?
If you or your delivery teams don't have the time to configure data models, you can pair this template with our Custom Column Mapping Service. Simply email us your plain text column headers. Our team handles the underlying Power Query automation behind the scenes and delivers a pre-linked, custom-mapped .pbix file straight to your inbox within two business days. No company data required.
Benefits
Benefits
This report helps teams understand resource capacity and demand across multiple projects. It reduces manual spreadsheet work and supports clearer planning conversations with stakeholders. Instead of paying a contract data engineer which may cost over £1,000 to build a complex capacity model from scratch or waiting in the queue for internal BI support, you can download this compiled PBIX file and get your resource reporting sorted immediately. Because it is delivered as a PBIX sample report, you can explore all visuals and interactions instantly without needing to connect a data source first.
The report runs entirely in the free Power BI Desktop application, so no Premium or Fabric licences are required.
Important notes
Important notes
Freedom Solutions is not affiliated with or endorsed by Microsoft. Microsoft and all Microsoft product names including Power BI, Excel, Power Apps, Power Automate, SharePoint, Teams and Office are trademarks of Microsoft Corporation.
The product is provided for individual use only. Redistribution, resale or public sharing, including modified versions, is not permitted without written permission.
The download includes a PBIX file and may also include an Excel file for demonstration purposes. Field names, data types or table structures may need adjustment to match your own organisational data model. Any included sample data is fictional and should be replaced before using the product for formal reporting.
All content is provided for informational and reporting purposes only. Freedom Solutions is not responsible for any decisions, actions, financial loss or operational impact resulting from how the product or its outputs are used.
By downloading the files, you accept Freedom Solutions Terms of Service.
© 2026 Freedom Solutions. All rights reserved.
Share