Freedom Solutions
Power BI Test Status Dashboard Report - PBIX + Excel
Power BI Test Status Dashboard Report - PBIX + Excel
Couldn't load pickup availability
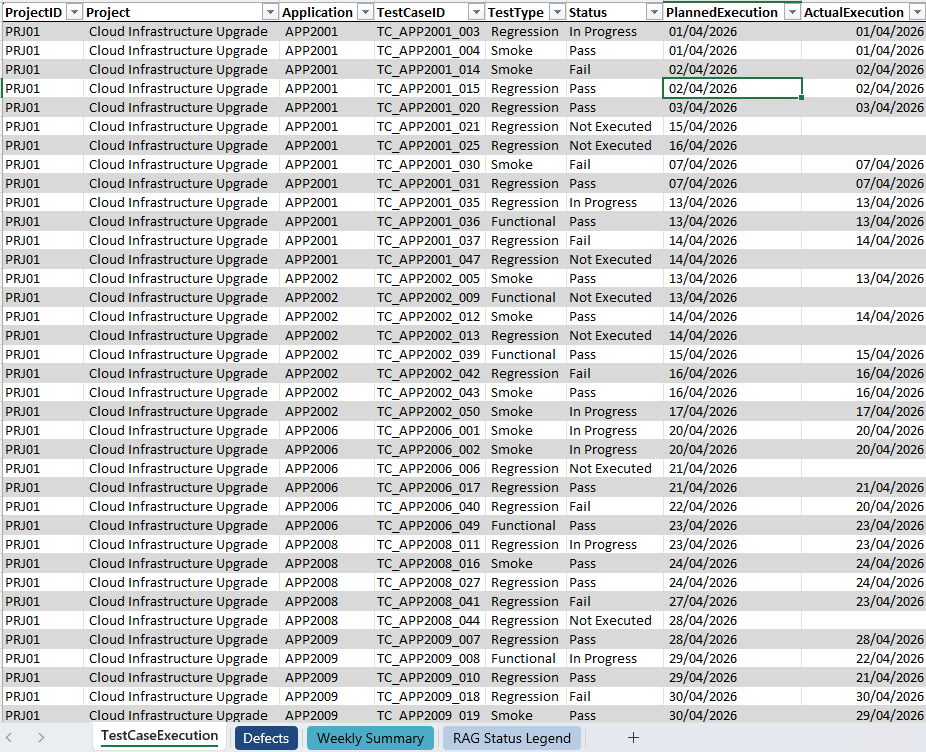
This Power BI Test Status Dashboard includes a curated Excel dataset with multiple aligned tables for test cases, execution status, defects, retests and severity levels. The data model reflects real QA and UAT reporting logic, making it easy to understand how the tables connect and how the visuals respond. The sample data is maintained regularly so timelines, relationships and defect patterns stay realistic. This gives you a complete, ready‑to‑use solution for testing, training or building your own QA/UAT reporting.
For the Claude & AI Developers
🤖 Claude-Ready Native Blueprint
- No hidden code, zero dodgy third-party plugins, and no weird custom scripts.
- We build our models using 100% native DAX and/or clean Power Query M-code, so they're completely transparent.
- If you’re using Claude Code, Claude Desktop, or an MCP server, just save this file as a Power BI Project (.pbip). It exposes the clean semantic model straight to your AI agent so you can spin up new measures or scale the framework without any hallucinations or formatting errors.
Overview
Overview
This dashboard provides a clear visual summary of QA and UAT progress. It includes KPIs, charts and tables that highlight execution status, defect trends, retest cycles and overall readiness for release. The included sample data shows how a real testing dataset should be structured.
Built using Power Query and DAX, the report sets out every transformation step clearly. This makes it an ideal learning tool for beginners whilst remaining powerful enough for intermediate users to extend.
Locked Reporting Context: The report utilises Page-Level Filters to fix the view to "Last Week" and specific projects. This ensures a clean, tamper-proof "Close of Business" snapshot for executive reviews without the clutter of on-canvas slicers.
Cross-Table Intelligence: The model expertly bridges the link between Test Cases and Defects. It uses advanced DAX to manage multiple fact tables without causing relationship conflicts.
Strategic Visibility: The report focuses on velocity vs. plan, allowing stakeholders to see if the programme is genuinely "On Track" or if the trends suggest an upcoming delay.
What's included
What's included
- A Power BI Desktop (.pbix) file with a fully built Test Status Dashboard
- A curated Excel file containing multiple test case information and aligned status tables.
- A schema with realistic timelines and relationships
- Fully fictional sample data designed for demonstration and training purpose only.
- Free lifetime updates - if the file is improved or updated in the future, you’ll receive the new version at no extra cost.
How to use it
How to use it
Power BI Desktop is required to open and use this report. No Premium or Fabric licences are needed unless you choose to publish it to the Power BI Service.
Quick Start Instructions
- Download: Save and extract the .zip package containing the .pbix file and the Excel data source.
- Repoint Data: Open the report in Power BI Desktop. Select 'Transform Data' > 'Data Source Settings' and point the source to the included Excel file.
- Filter & Refresh: Use the Filters Pane to select your project and the "Last Week" period. The visuals will update instantly with the starter data.
You can rename fields, adjust visuals or extend the model to match your QA/UAT process. The sample data helps you understand how the dashboard works before connecting your own information.
Want a completely hands-off setup?
If you or your delivery teams don't have the time to configure data models, you can pair this template with our Custom Column Mapping Service. Simply email us your plain text column headers. Our team handles the underlying Power Query automation behind the scenes and delivers a pre-linked, custom-mapped .pbix file straight to your inbox within two business days. No company data required.
Benefits
Benefits
This template saves hours of setup time and gives you a complete structure for QA and UAT reporting. The included sample data shows how multiple tables should align in a real testing environment, including relationships between test cases, defects and execution status. It’s ideal for test managers, project teams and anyone responsible for reporting test readiness or defect trends.
Important notes
Important notes
Freedom Solutions is not affiliated with or endorsed by Microsoft. Microsoft and all Microsoft product names including Power BI, Excel, Power Apps, Power Automate, SharePoint, Teams and Office are trademarks of Microsoft Corporation.
The product is provided for individual use only. Redistribution, resale or public sharing, including modified versions, is not permitted without written permission.
The download includes a PBIX file and may also include an Excel file for demonstration purposes. Field names, data types or table structures may need adjustment to match your own organisational data model. Any included sample data is fictional and should be replaced before using the product for formal reporting.
All content is provided for informational and reporting purposes only. Freedom Solutions is not responsible for any decisions, actions, financial loss or operational impact resulting from how the product or its outputs are used.
By downloading the files, you accept Freedom Solutions Terms of Service.
© 2026 Freedom Solutions. All rights reserved.
Share